from Silver Tiger Metals Inc. (CVE:SLVR)
Silver Tiger Announces a PEA for the Underground with an After Tax NPV of US$304m and an Updated PFS for the Stockwork Zone with an After Tax NPV of US$456m at the El Tigre Silver-Gold Project, Sonora, Mexico
HALIFAX, NS / ACCESS Newswire / January 20, 2026 / Silver Tiger Metals Inc. (TSXV:SLVR) and (OTCQX:SLVTF) ("Silver Tiger" or the "Corporation") is pleased to announce the results of a Preliminary Economic Assessment ("PEA") on the underground at El Tigre and an updated Pre-Feasibility Study ("PFS") on the Stockwork Zone for its 100% owned, silver-gold El Tigre Project (the "Project" or "El Tigre") located in Sonora, Mexico. The bolt-on PEA is centred on the underground mining economics of the high-grade El Tigre, Sulphide, Black Shale and Seitz Kelly zones. The underground PEA and updated PFS is based on new consensus economics metal prices of $38 per ounce silver and $3,200 per ounce gold. The PEA mine design can be constructed independently of the Stockwork Zone development and is focused on the underground Mineral Resource. Prospective areas exist outside of the areas defined by the PEA and PFS with the historic "El Tigre North Mine" Mineral Resource located 700 metres to the North (see Exploration Potential section below).
Highlights of the PEA , with a base case silver price of $38/oz and gold price of $3,200/oz are as follows (all figures in US dollars unless otherwise stated):
After-Tax net present value ("NPV") (using a discount rate of 5%) of $304 million with an After-Tax IRR of 42.8% and Payback Period of 2.6 years (Base Case);
15-year UG mine life with 3-year historical tailings processing recovering a total of 38 million payable silver equivalent ounces ("AgEq") or 453 thousand gold equivalent ounces ("AuEq"), consisting of 34 million silver ounces and 130 thousand gold ounces;
Total Project undiscounted after-tax cash flow of $496 million;
Initial capital costs of $83.5 million, including $10.9 million in contingency costs, over an expected 18-month build, and sustaining capital costs of $213 million over the life of mine ("LOM");
The 2026 PEA mine plan is designed as stand-alone to the PFS, with a potential overlap of initial capital cost of $17M (e.g., grid power, offices);
Average LOM operating cash costs of $1,351/oz AuEq, and all in sustaining costs ("AISC") of $2,019/oz AuEq or Average LOM operating cash costs of $16.05/oz AgEq, and AISC of $23.98/oz AgEq;
Average annual production of approximately 2.3 million AgEq oz or 27.8 thousand AuEq oz, consisting of 2.1 million silver ounces and 8.0 thousand gold ounces (refer to Table 10 footnotes for conversion to Eq ozs); and
PEA Study of the Southern Veins does not include the 38 million ounces AgEq contained in the Northern Veins (see details in updated Mineral Resource Estimate below).
Highlights of the updated PFS , with new base case silver price of $38/oz and gold price of $3,200/oz are as follows (all figures in US dollars unless otherwise stated):
After-Tax net present value ("NPV") (using a discount rate of 5%) of $456 million with an After-Tax IRR of 65.7% and Payback Period of 1.4 years;
10-year mine life recovering a total of 43 million payable silver equivalent ounces ("AgEq") or 509 thousand payable gold equivalent ounces ("AuEq"), consisting of 9 million silver ounces and 408 thousand gold ounces;
Total Project undiscounted after-tax cash flow of $625 million;
Initial capital costs of $86.8 million, which includes $9.3 million of contingency costs, over an expected 18-month build, expansion capital of $20.1 million in year 3 and sustaining capital costs of $6.2 million over the life of mine ("LOM");
Average LOM operating cash costs of $997/oz AuEq, and all in sustaining costs ("AISC") of $1,238/oz AuEq or Average LOM operating costs of $11.7/oz AgEq, and all in sustaining costs ("AISC") of $14.5/oz AgEq;
Average annual production of approximately 4.8 million AgEq oz or 56.5 thousand AuEq oz; and
Three (3) years of production in the Proven category in the Phase 1 Starter Pit with 60% of overall final pit Mineral Reserve in Proven category.
Glenn Jessome, President and CEO, stated "This updated PFS for the Stockwork Zone and initial PEA for the underground provide the first look at the combined economics of El Tigre. At current spot silver and gold prices, the Stockwork Zone Project generates an after-tax NPV of approximately $950 million US dollars and the underground project generates an after-tax NPV of approximately $1.20 billion US dollars at a discount rate of 5%. At current spot silver and gold prices, the Stockwork Zone Project generates approximately $1.30 billion US dollars of net cashflow after tax over life of mine and the underground project generates approximately $1.85 billion US dollars of net cashflow after tax over life of mine." Mr. Jessome further stated, "In the backdrop of all-time high silver and gold prices we are completing detailed engineering and proceeding to build the Stockwork Zone Project." Mr. Jessome continued, "The underground at El Tigre is a standalone bolt-on project and we intend to complete development for this low capex underground project and advance towards production as quickly as possible."
Underground Preliminary Economic Assessment Summary
The PEA was prepared by independent consultants P&E Mining Consultants Inc. ("P&E"), with metallurgical test work completed by SGS Lakefield, geotechnical work by WSP Canada Ltd., process plant design and costing by D.E.N.M. Engineering Ltd., and environmental and permitting led by CIMA Mexico.
The 2026 PEA underground mine and mineral processing plan is scheduled over a production period of ~17 years. The mine plan portion of the Mineral Resource Estimate for the El Tigre 2026 PEA totals 5.0 Mt at average grades of 331.7 g/t AgEq, 251.3 g/t Ag, 0.91 g/t Au, 0.03% Cu, 0.10% Pb and 0.17% Zn (base metals provide no economic benefit under the proposed cyanidation process). Approximately 85% of the mine plan portion of the Mineral Resource, including historical tailings and low-grade stockpile mineralization, is classified as Measured and Indicated.
Following are tables and figures showing key assumptions, results, and sensitivities.
Figure 1: El Tigre -UG PEA Stopes and Development by Zone (Southern Veins)

Table 1: El Tigre UG PEA Key Economic Assumptions and Results
Assumption / Result | Unit | Value | Assumption / Result | Unit | Value |
|---|---|---|---|---|---|
Plant Feed Processed | kt | 5,023 | Net Revenue | US$M | 1,665.4 |
Waste Rock Mined | kt | 2,439 | Initial Capital | US$M | 83.5 |
Silver Grade | g/t | 251.3 | Sustaining Capital | US$M | 213.6 |
Gold Grade | g/t | 0.91 | Mining and Haulage Costs | $/t processed | 62.49 |
Silver Recovery (UG) | % | 84 | Processing Costs (UG and Stockpile) | $/t processed | 41.55 / 24.25 |
Gold Recovery (UG) | % | 90 | G&A Costs | $/t processed | 18.71 |
Silver Price | US$/oz | 38.00 | Operating Cash Cost | US$/oz AgEq | 16.0 |
Gold Price | US$/oz | 3,200 | All-in Sustaining Cost | US$/oz AgEq | 24.0 |
Payable Silver Metal | Moz | 33.6 | After-Tax NPV (5% discount) | US$M | 304.0 |
Payable Gold Metal | koz | 130 | Pre-Tax NPV (5% discount) | US$M | 487.3 |
Payable AgEq | Moz | 38.5 | After-Tax IRR | % | 42.8 |
Production and Reclamation | years | 18 | Pre-Tax IRR | % | 65.2 |
Average Feed Processed | tpd | 800 | After-Tax Payback Period | years | 2.6 |
Figure 2 : El Tigre UG PEA Cash Flow Profile by Year
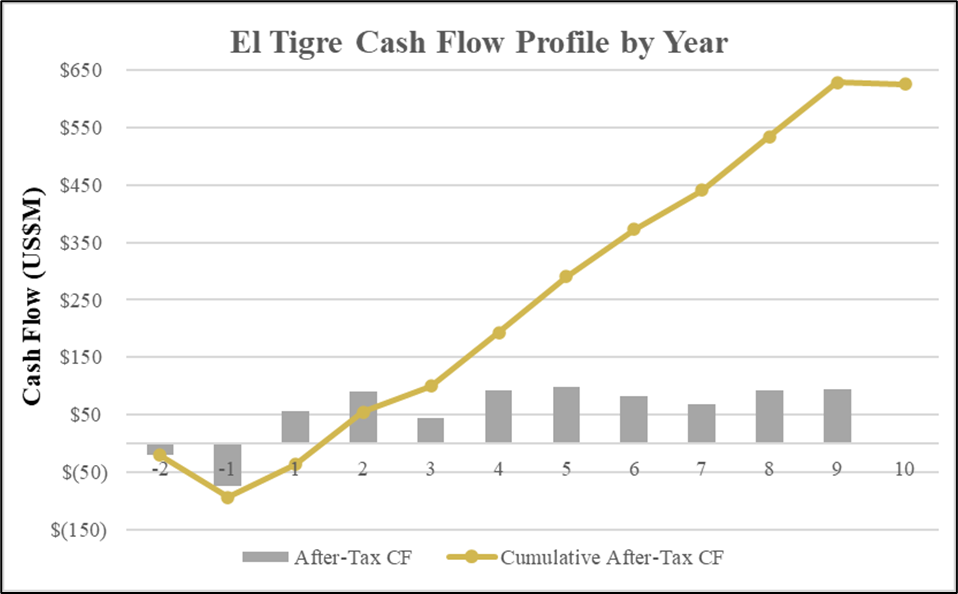
Figure 2 above highlights the after-tax cash flows of $496 million associated with the UG component of the Project. The economics of the Project have been evaluated based on the base case scenario $38/oz silver price, and gold price of $3,200/oz. As illustrated in the following sensitivity tables, the Project remains robust even at lower commodity prices or with higher costs.
Table 2: El Tigre PEA Gold and Silver Price Sensitivities
Sensitivity | -20% | -10% | Base Case | +10% | +20% |
|---|---|---|---|---|---|
Silver Price (US$/oz) | 30 | 34 | 38 | 42 | 46 |
Gold Price (US$/oz) | 2,560 | 2,880 | 3,200 | 3,520 | 3,840 |
After-Tax NPV (5%) (US$M) | 153.9 | 229.1 | 304.0 | 378.9 | 453.9 |
After-Tax IRR (%) | 24.8 | 33.8 | 42.8 | 51.8 | 61.0 |
After-Tax Payback (years) | 3.5 | 3.0 | 2.6 | 2.2 | 1.9 |
Table 3: El Tigre PEA Operating Cost and Capital Cost Sensitivities
Sensitivity | -20% | -10% | Base Case | +10% | +20% |
|---|---|---|---|---|---|
Operating Costs - NPV 5 (US$M) | 354.9 | 329.5 | 304.0 | 278.6 | 253.2 |
Operating Costs - IRR (%) | 48.2 | 45.5 | 42.8 | 40.1 | 37.4 |
Capital Costs - NPV 5 (US$M) | 337.1 | 320.6 | 304.0 | 287.5 | 271.0 |
Capital Costs - IRR (%) | 55.1 | 48.4 | 42.8 | 38.1 | 34.0 |
Capital and Operating Costs
Capital and Operating costs are listed in Table 4 below. The El Tigre Underground Project has been envisioned as an independent underground operation at a processing rate of 800 tonnes per day with a mine lifeof15 years. Before full UG production, historical stockpile material (119 kt @176 g/t Ag and 0.85 g/t Au) is processed in Year-1. After UG production is complete in Year 15, historical tailings (904 kt @ 77.6 g/t Ag and 0.27 g/t Au) will be processed for an additional three years.
If the 2026 PEA mine plan was to be implemented after mining commenced as detailed in the PFS sections of the Technical Report, there would be a potential savings in PEA initial capital costs of approximately $17.0M. The savings would consist of infrastructure such as the electrical powerline for grid power, and camp and office facilities, plus much of the owner's costs.
Water supply to the process plant is provided by pumping nearby water from dewatering wells to the process area water distribution system, and high voltage grid power will be installed by the local utility to supply process and infrastructure electrical requirements.
Table 4: LOM Capital Cost Estimate
2026 PEA Capital Cost Summary | |||
Item | Initial | Sustaining | Total |
($k) | ($k) | ($k) | |
Process Plant Directs | 22,298 | - | 22,298 |
Process Plant Indirects | 8,811 | - | 8,811 |
Underground Mining | 49,518 | 173,508 | 223,026 |
Infrastructure | 6,449 | - | 6,449 |
Dry Stack Tailings | 3,978 | 12,230 | 16,208 |
Owner's Costs | 10,743 | - | 10,743 |
Pre-production revenues | (29,175) | - | (29,175) |
Subtotal | 72,622 | 185,738 | 258,360 |
Contingencies @ 15% | 10,893 | 27,861 | 38,754 |
Total | 83,515 | 213,599 | 297,114 |
Mining
The El Tigre Underground Project is planned as a contractor-operated longhole mining operation with cemented paste backfill supplemented by minor mechanized cut and fill mining and recovery of existing low grade and tailings stockpiles. Underground mining contributes approximately 4,000 kt of mineralized material, with 119 kt from an historical low grade stockpile and 904 kt from an historical tailings stockpile, for a total of 5,022.8 kt grading over the LOM on average 331.7 g/t AgEq, 251.3 g/t Ag, 0.91 g/t Au, 0.033% Cu, 0.099% Pb and 0.166% Zn; base metals provide no economic benefit under the cyanidation process. Underground production is scheduled at 290 kt per annum ("ktpa"), giving an underground mine life of approximately 15 years and an overall Project life of approximately 18 years. Process plant commissioning with low grade stockpile material is planned in Year -1, and processing of historical tailings stockpile at 365 ktpa is scheduled for three years after underground mining is depleted.
Metallurgy
A metallurgical test program was carried out by SGS Lakefield of Ontario, Canada. The program included grinding and flotation work. The samples comprised of drill core sampling rejects representing the various zones of the Mineral Resource. This test program estimated average gold and silver respective hardrock metallurgical recoveries of 84.4% and 89.7% for silver and gold respectively. While base metals were recoverable, it was determined that the mined value of copper, lead and zinc does not justify the recovery cost of their respective metallurgical circuits.
Stockwork Zone Updated Pre-Feasibility Study Summary
The updated PFS used higher metal prices than the 2024 PFS (see release dated Oct 22, 2024) and was prepared by independent consultants P&E Mining Consultants Inc. ("P&E"), with metallurgical test work completed by McClelland Laboratories, Inc., Sparks, Nevada, process plant design and costing by D.E.N.M. Engineering Ltd., environmental and permitting led by CIMA Mexico and geotechnical design by WSP Canada Ltd.
The base case LOM is scheduled over a period of ten years (one year of preproduction and nine production years). The Proven and Probable Mineral Reserve Estimate for the El Tigre Project totals 40.3 Mt at average grades of 0.40 g/t Au and 14.9 g/t Ag. Approximately 60% of the Mineral Reserve is classified as Proven.
Surface mining will be initiated in Year -1 (pre-stripping period) and will be completed in Year 9. The initial ore heap leaching rate (Years 1 to 3) is 7,500 tpd (2.74 Mta). In Year 4 the crushing rate will increase to 15,000 tpd (5.5 Mtpa) and this rate is maintained to the end of the mine life. The El Tigre Mine is planned to be a contract mining operation. Over the LOM, 68.3 Mt of waste rock will be mined, with 40.3 Mt ore, for a total of 108.6 Mt at a strip ratio of 1.7:1.
After-Tax net present value ("NPV") (using a discount rate of 5%) of $456 million with an After-Tax IRR of 65.7% and Payback Period of 1.4 years over 10-year mine life recovering a total of 43 million payable silver equivalent ounces ("AgEq") or 509 thousand payable gold equivalent ounces ("AuEq"), consisting of 9 million silver ounces and 408 thousand gold ounces. Total Project undiscounted after-tax cash flow of $625 million with initial capital costs of $86.8 million, which includes $9.3 million of contingency costs, over an expected 18-month build. An expansion capital allocation of $20.1 million is planned in year 3 with sustaining capital costs of $6.2 million over the life of mine ("LOM"). Following are tables and figures showing key assumptions, results, and sensitivities.
Table 5: El Tigre PFS Key Economic Assumptions and Results (1-2)
Assumption / Result | Unit | Value | Assumption / Result | Unit | Value | |
|---|---|---|---|---|---|---|