

on Fresenius SE & Co. KGaA (ETR:FRE)
Fresenius Shows Strong Performance in Q3 2026
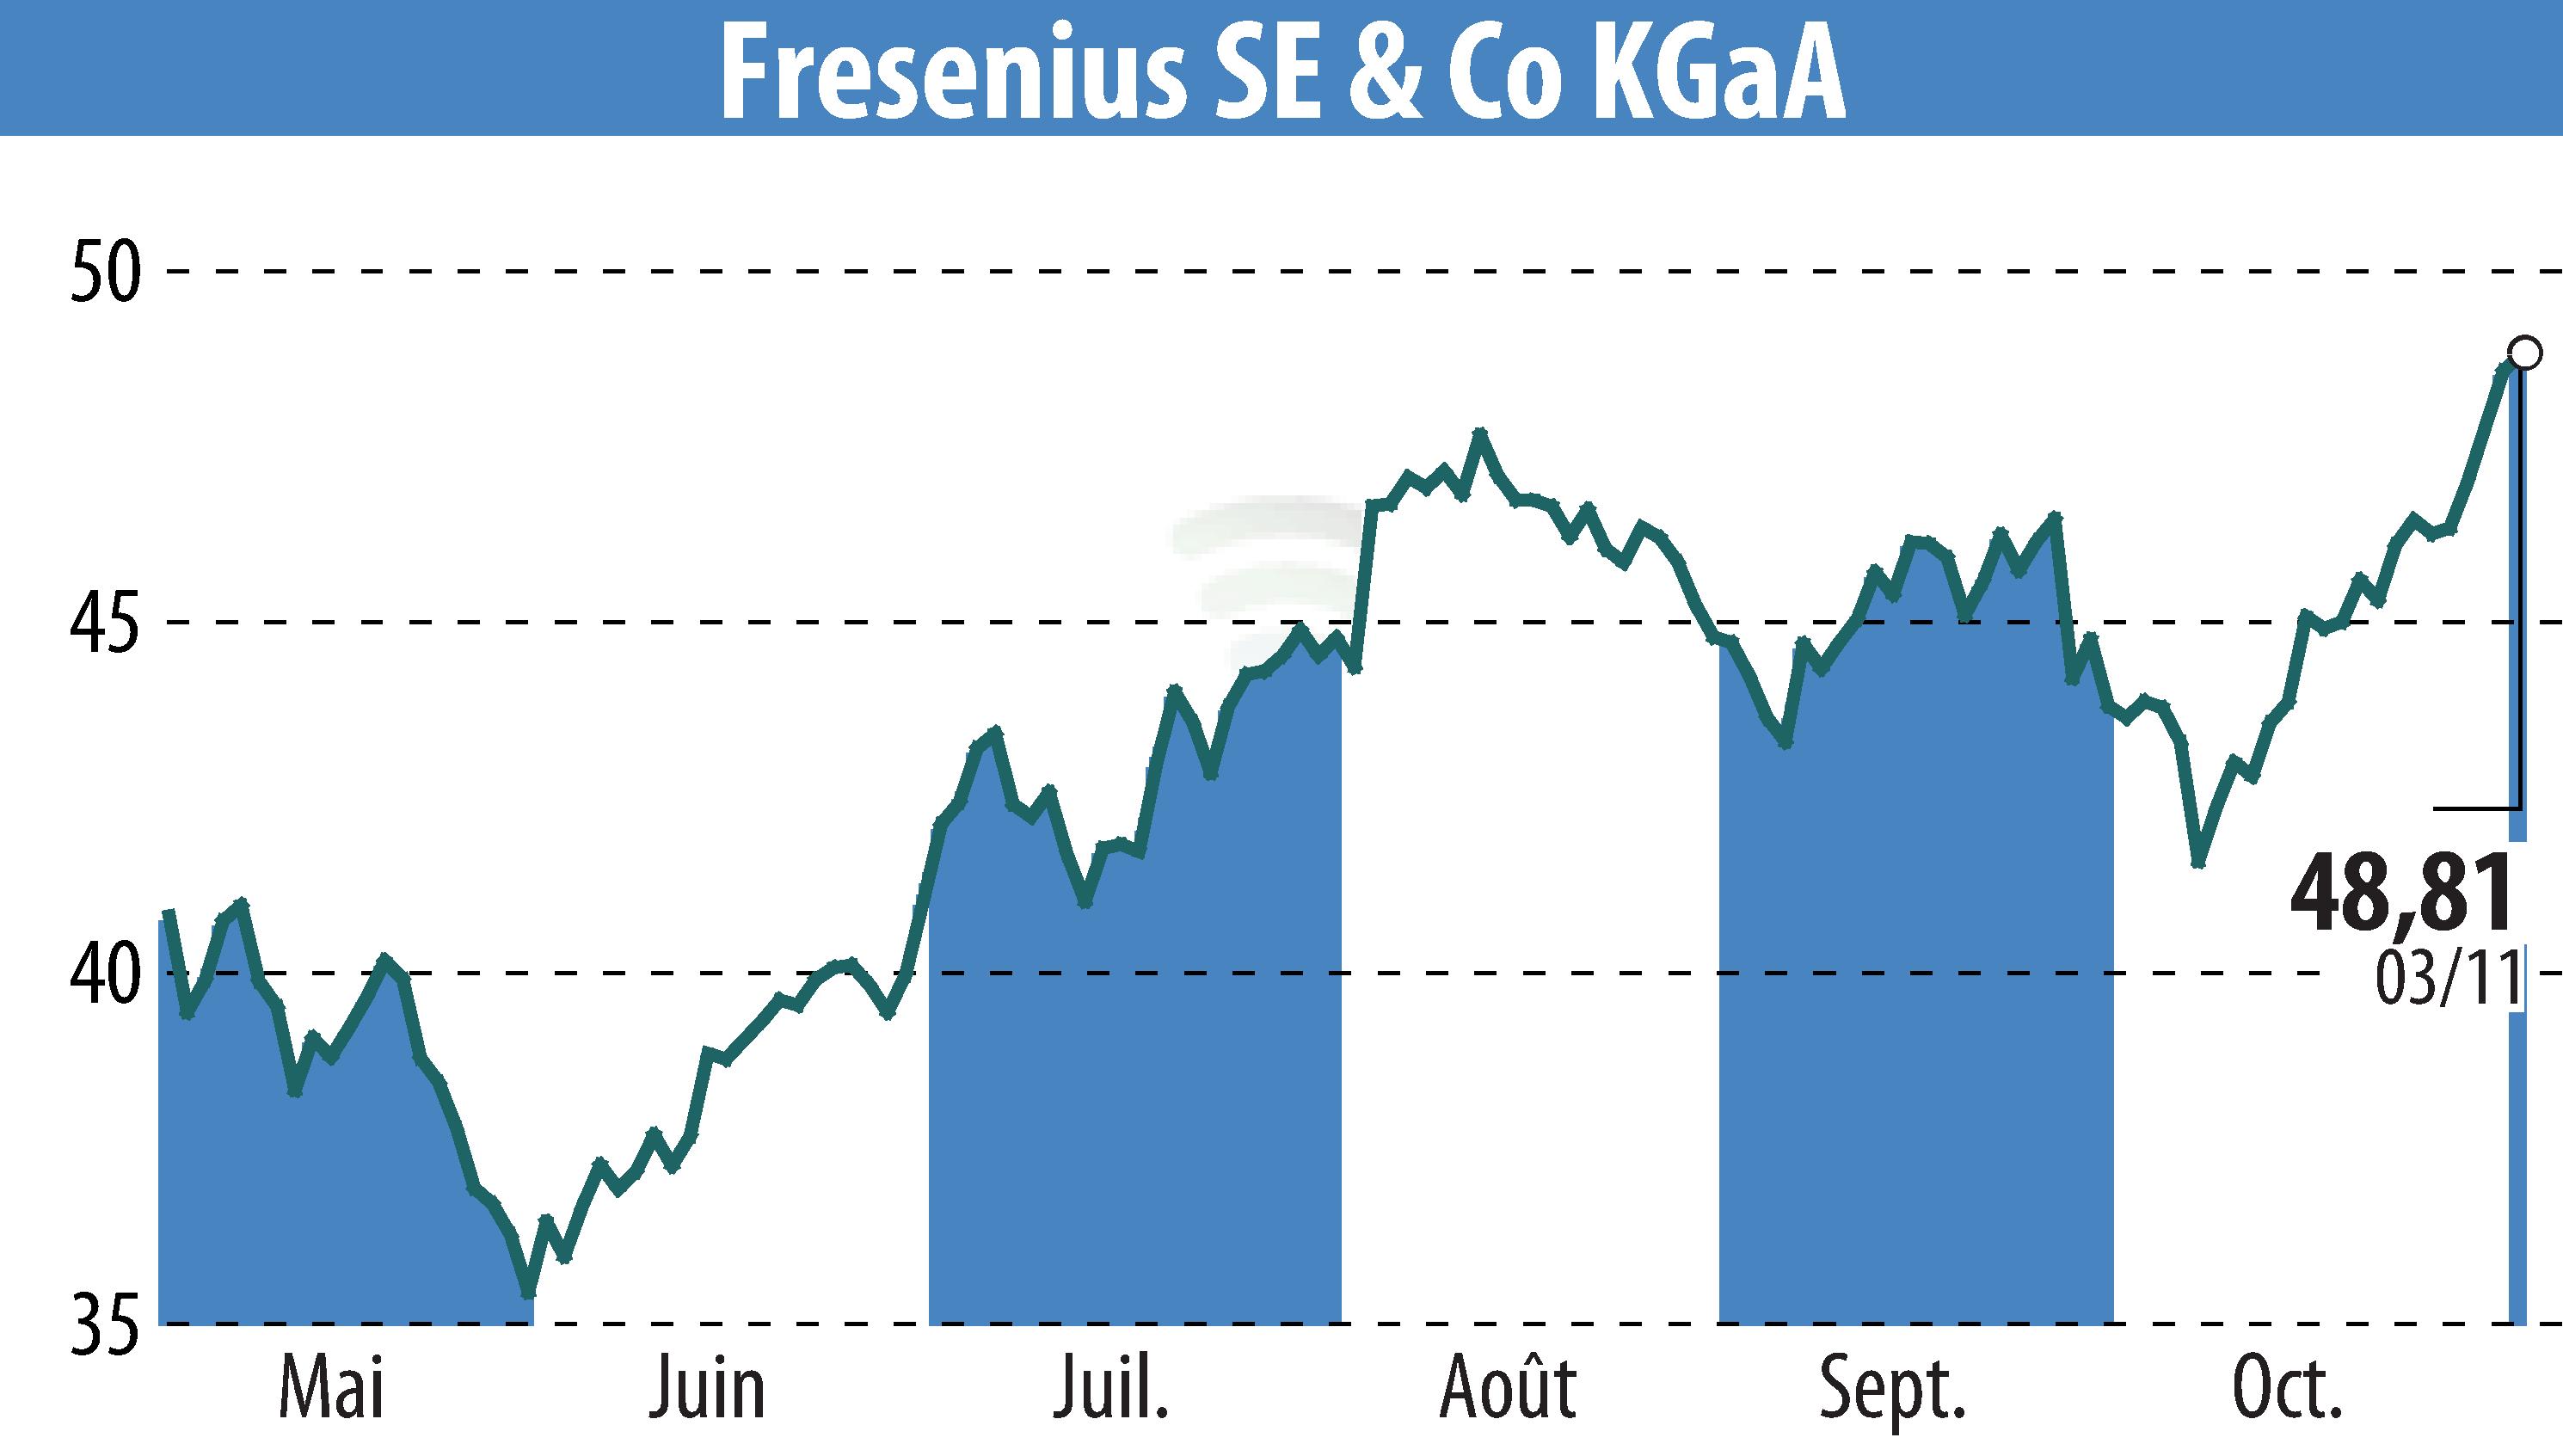
Fresenius SE & Co. KGaA reported a successful third quarter in 2026, highlighting structural improvements and noteworthy growth in revenue and earnings. The company achieved organic revenue growth of 5%, totaling €5,803 million, driven primarily by Fresenius Kabi and Fresenius Helios. The Group saw a 14% increase in Core EPS at constant currency, attributed to strong operations and reduced interest expenses.
Fresenius is scaling its Biopharma business through strategic investments, including an agreement with WuXi Biologics to expand its biosimilars pipeline. This partnership offers exclusive access to up to 37 potential biosimilars and is expected to boost the company’s portfolio significantly in the coming decade.
The company's EBIT growth was propelled by Fresenius Kabi’s Growth Vectors and robust performance in the hospital sector despite seasonal challenges. The Group's EBIT margin rose to 11.0%, with expectations to exceed 11.5% for the fiscal year. Fresenius continues to advance its #FutureFresenius strategy, laying the groundwork for future growth.
R. P.
Copyright © 2026 FinanzWire, all reproduction and representation rights reserved.
Disclaimer: although drawn from the best sources, the information and analyzes disseminated by FinanzWire are provided for informational purposes only and in no way constitute an incentive to take a position on the financial markets.
Click here to consult the press release on which this article is based
See all Fresenius SE & Co. KGaA news